This page describes five of the nine acoustic features that we use in the OpenVokaturi library, and measures them on the Emo_DB database with both Praat and Vokaturi.
1. The acoustic cues
The features extracted by our analysis algorithm are simply the results of some of the main voice analysis functions in the Praat program (Boersma & Weenink 1992–2019). In section 2 we describe the reimplementation in the OpenVokaturi software library.
1.1 Average pitch (pitAve)
The average pitch of the utterance in semitones relative to 100 Hz, as measured with Sound: To Pitch… in Praat, with standard settings. The algorithm is by Boersma (1993).
1.2 Pitch dynamics (pitDyn)
The average absolute pitch slope in semitones per second, as measured with Get absolute slope without octave jumps. Every local jump of more than 6 semitones is diminished by one or more octaves; for instance, an upward pitch jump of 9 semitones is regarded as a downward pitch jump of 3 semitones (12 semitones is an octaves).
1.3 Average intensity (intAve)
The average intensity in dB, as measured with Sound: To Intensity in Praat, with standard settings. This measurement is problematic, as it depends on the sensitivity of the microphone, the gain of the microphone amplifier (different on every type of phone or other recording device), and the distance between the human speaker and the microphone. As a matter of principle, this feature should probably not be considered as a predictor of emotion.
1.4 Intensity dynamics (intDyn)
The mean absolute slope of the intensity, in dB per second. This is measured over only the voiced parts, because the voiceless parts may include parts where the human speaker is silent. In those parts, the measured intensity value would equal that of the background noise, whose level strongly depends on the recording environment.
1.5 Spectral slope (spcSlo)
The difference in energy (in dB) between the frequency band between 50 and 1000 Hz and the frequency band between 1000 and 4000 Hz, where averaging is performed in dB units. Probably better to do the averaging in sone units (Boersma & Kovačić 2006:1811). The method used is “pitch-corrected LTAS” (Boersma & Kovačić 2006:1807), which considers the spectrum only in the voiced parts of the recording and correct for non-smooth pitch distributions.
2. Acoustic analysis
2.1 Acoustic analysis with Praat
A Praat script runs the Praat acoustic algorithms on all 535 recordings in Emo-DB.
The script extract_cues.praat:
# Praat script extract_cues.praat
# Paul Boersma 2016-10-09

table = Create Table with column names: "table", 0,
... "Spea Utt Emo" +
... " pitAve pitDir pitDyn pitJit intAve intDyn intJit spcSlo spcJit"

emotion$ ["W"] = "Ang"   ; "Ärger (Wut)"  ->  Anger
emotion$ ["L"] = "Bor"   ; "Langeweile"   ->  Boredom
emotion$ ["E"] = "Dis"   ; "Ekel"         ->  Disgust
emotion$ ["A"] = "Fea"   ; "Angst"        ->  Fear or Anxiety
emotion$ ["F"] = "Hap"   ; "Freude"       ->  Happiness or Joy
emotion$ ["T"] = "Sad"   ; "Trauer"       ->  Sadness
emotion$ ["N"] = "Neu"   ; "neutral"      ->  Neutral

emoDB_path$ = "../../databases/Emo-DB"
files = Create Strings as file list: "files", emoDB_path$ + "/wav/*.wav"
numberOfFiles = Get number of strings
for ifile to numberOfFiles

    selectObject: files
    fileName$ = Get string: ifile
    sound = Read from file: emoDB_path$ + "/wav/" + fileName$
    speaker$ = "sp" + mid$ (fileName$, 1, 2)
    sentence$ = mid$ (fileName$, 3, 3)
    emotionCode$ = mid$ (fileName$, 6, 1)

    #
    # Get the pitch cues.
    #
    selectObject: sound
    pitch = noprogress To Pitch: 0.0, 75.0, 600.0
    pitAve = Get mean: 0, 0, "semitones re 100 Hz"
    pitDir = randomGauss (1.0, 0.01)   ; not implemented
    pitDyn = Get slope without octave jumps
    pitJit = randomGauss (1.0, 0.01)   ; not implemented

    #
    # Get the intensity cues.
    #
    selectObject: sound
    intensity = noprogress To Intensity: 100, 0, "yes"
    plusObject: pitch
    intAve = Get mean
    intDyn = Get mean absolute slope
    intJit = randomGauss (1.0, 0.01)   ; not implemented

    #
    # Get the spectral cues.
    #
    selectObject: sound
    ltas = noprogress To Ltas (pitch-corrected): 75, 600, 5000, 50, 0.0001, 0.02, 1.3
    spcSlo = Get slope: 50, 1000, 1000, 4000, "dB"
    spcJit = randomGauss (1.0, 0.01)   ; not implemented

    selectObject: table
    Append row
    Set string value: ifile, "Spea", speaker$
    Set string value: ifile, "Utt", sentence$
    Set string value: ifile, "Emo", emotion$ [emotionCode$]
    Set string value: ifile, "pitAve", fixed$ (pitAve, 3)
    Set string value: ifile, "pitDir", fixed$ (pitDir, 3)
    Set string value: ifile, "pitDyn", fixed$ (pitDyn, 3)
    Set string value: ifile, "pitJit", fixed$ (pitJit, 3)
    Set string value: ifile, "intAve", fixed$ (intAve, 3)
    Set string value: ifile, "intDyn", fixed$ (intDyn, 3)
    Set string value: ifile, "intJit", fixed$ (intJit, 3)
    Set string value: ifile, "spcSlo", fixed$ (spcSlo, 3)
    Set string value: ifile, "spcJit", fixed$ (spcJit, 3)

    removeObject: sound, pitch, intensity, ltas
endfor

Save as tab-separated file: "cuesP.Table"
removeObject: table, files
The complete table has 535 rows. The first 20 rows look like this when loaded into R (Spea = the speaker, Utt = the utterance that was read, Emo = the intended emotion):
options (width=100)
cuesP <- read.delim("cuesP.Table")
head (cuesP, n=20)
## Spea Utt Emo pitAve pitDir pitDyn pitJit intAve intDyn intJit spcSlo spcJit
## 1 sp03 a01 Hap 8.537 1.004 39.660 0.986 71.398 183.360 0.991 -16.833 0.999
## 2 sp03 a01 Neu 2.598 1.008 31.109 0.996 77.085 143.669 1.000 -16.151 0.997
## 3 sp03 a01 Ang 11.948 0.979 34.987 1.006 75.000 220.271 1.005 -5.707 1.014
## 4 sp03 a02 Hap 15.059 0.993 30.832 1.014 74.701 191.202 1.013 -13.978 0.991
## 5 sp03 a02 Neu 2.646 1.010 27.813 1.002 77.914 185.274 0.990 -15.414 0.995
## 6 sp03 a02 Sad 0.684 0.999 22.861 0.995 77.606 120.130 1.010 -18.960 0.989
## 7 sp03 a02 Ang 12.034 1.011 40.088 0.995 72.869 174.579 0.992 -8.128 0.987
## 8 sp03 a02 Ang 16.052 0.981 40.431 0.995 71.946 236.387 0.987 -5.132 0.991
## 9 sp03 a04 Fea 14.648 0.990 48.400 0.999 73.715 204.416 0.989 -12.998 0.995
## 10 sp03 a04 Hap 11.668 1.002 38.946 0.997 72.232 224.744 1.012 -13.587 1.007
## 11 sp03 a04 Bor 0.717 0.988 35.762 0.990 73.816 105.877 1.010 -18.504 1.009
## 12 sp03 a04 Neu 2.171 0.982 37.806 0.989 74.673 174.757 0.997 -17.735 0.986
## 13 sp03 a04 Sad -0.149 1.005 34.758 1.010 76.409 105.082 1.000 -22.881 1.020
## 14 sp03 a04 Ang 14.899 0.998 41.014 1.010 72.605 210.170 0.985 -7.973 0.991
## 15 sp03 a05 Fea 14.263 0.980 52.354 1.004 74.219 223.983 1.000 -15.299 0.996
## 16 sp03 a05 Hap 11.873 0.981 43.752 0.995 74.199 237.989 0.998 -16.100 1.003
## 17 sp03 a05 Neu 4.120 1.001 34.953 1.009 76.348 187.217 0.997 -17.015 1.014
## 18 sp03 a05 Sad 0.995 0.993 38.355 1.005 77.032 165.812 1.002 -20.276 0.997
## 19 sp03 a05 Ang 10.743 1.007 36.125 0.999 72.613 196.270 1.020 -10.924 1.006
## 20 sp03 a05 Ang 16.219 1.017 43.058 1.005 73.417 243.899 0.996 -8.335 1.0162.2 Acoustic analysis with Vokaturi
The Vokaturi library contains algorithms that approximate the acoustic analyses of Praat. A C program runs the acoustic analyses of the Vokaturi library on Emo_DB:
/*
    MeasureCues9.c
    public-domain sample code by Vokaturi, 2017-01-03

    A program that measures the nine cues
    in all files in the Emo-DB database.
*/

#include <dirent.h>
#include <unistd.h>
#include "WavFile.h"
#include "Emotions.h"
#include "Vokaturi9.h"

int main (int argc, const char * argv[]) {
    const char *indirName = "/Users/pboersma/Vokaturi/databases/Emo-DB/wav/";
    const char *outfileName = "/Users/pboersma/Vokaturi/www/doc/cuesV.Table";

    DIR *indir = opendir (indirName);
    FILE *outfile = fopen (outfileName, "w");
    struct dirent *entry;
    chdir (indirName);

    /*
        Print the header of the table.
    */
    fprintf (outfile, "File\tEmo\t"
        "pitAve\tpitDir\tpitDyn\tpitJit\tintAve\tintDyn\tintJit\tspcSlo\tspcJit\n");

    while ((entry = readdir (indir)) != NULL) {
        const char *fileName = entry -> d_name;
        if (fileName [0] == '.') continue;   // ignore hidden files

        VokaturiWavFile wavFile;
        VokaturiWavFile_open (fileName, & wavFile);
        if (! VokaturiWavFile_valid (& wavFile)) {
            fprintf (stderr, "Error: WAV file not analyzed.\n");
            exit (1);
        }

        VokaturiVoice voice = VokaturiVoice_create
            (wavFile.samplingFrequency, wavFile.numberOfSamples);

        VokaturiWavFile_fillVoice (& wavFile, voice, 0, 0, wavFile.numberOfSamples);

        VokaturiQuality quality;
        CueStrengths9 cueStrengths;
        VokaturiVoice_extractCues9 (voice, & quality, cueStrengths);

        if (quality.valid) {
            const char *emotion =
                fileName [5] == 'N' ? "Neu" :   // Neutral
                fileName [5] == 'F' ? "Hap" :   // Freude
                fileName [5] == 'T' ? "Sad" :   // Trauer
                fileName [5] == 'W' ? "Ang" :   // Wut
                fileName [5] == 'A' ? "Fea" :   // Angst
                fileName [5] == 'L' ? "Bor" :   // Langeweile
                fileName [5] == 'E' ? "Dis" :   // Ekel
                "???";
            fprintf (outfile,
                "%.7s\t%s\t%.3f\t%.3f\t%.3f\t%.3f\t%.3f\t%.3f\t%.3f\t%.3f\t%.3f\n",
                fileName, emotion, cueStrengths [CUE_pitAve],
                cueStrengths [CUE_pitDir], cueStrengths [CUE_pitDyn],
                cueStrengths [CUE_pitJit], cueStrengths [CUE_intAve],
                cueStrengths [CUE_intDyn], cueStrengths [CUE_intJit],
                cueStrengths [CUE_spcSlo], cueStrengths [CUE_spcJit]);
        }

        VokaturiVoice_destroy (voice);
        VokaturiWavFile_clear (& wavFile);
    }
    closedir (indir);
    fclose (outfile);
}
The first 20 rows of the resulting table look like this:
cuesV <- read.delim("cuesV.Table")
head (cuesV, n=20)
## File Emo pitAve pitDir pitDyn pitJit intAve intDyn intJit spcSlo spcJit
## 1 03a01Fa Hap 7.843 0.069 47.044 225.261 70.152 123.866 124.783 -24.761 291.425
## 2 03a01Nc Neu 3.106 -1.481 34.479 81.602 77.124 119.133 135.310 -23.003 279.199
## 3 03a01Wa Ang 11.538 -0.748 39.850 239.541 74.989 119.830 125.678 -11.895 236.128
## 4 03a02Fc Hap 14.277 0.144 40.608 49.205 74.946 139.700 116.640 -21.835 260.228
## 5 03a02Nc Neu 2.779 -0.088 36.414 35.817 78.388 136.579 98.402 -23.546 228.249
## 6 03a02Ta Sad 0.952 -0.552 32.832 49.909 78.794 68.814 84.168 -26.579 231.741
## 7 03a02Wb Ang 10.099 0.255 53.830 255.318 71.987 122.662 126.559 -14.212 199.145
## 8 03a02Wc Ang 14.640 -0.849 55.092 304.520 70.945 147.799 187.774 -7.266 225.950
## 9 03a04Ad Fea 14.507 -2.025 62.848 312.140 75.534 138.105 161.663 -17.021 320.762
## 10 03a04Fd Hap 10.980 -1.137 46.569 34.599 72.555 102.452 138.891 -19.524 353.262
## 11 03a04Lc Bor 1.092 -0.188 24.335 128.274 74.766 64.655 49.598 -20.210 140.245
## 12 03a04Nc Neu 1.666 -0.263 40.141 45.790 74.118 147.766 132.240 -18.446 345.596
## 13 03a04Ta Sad -1.136 -0.789 30.915 45.678 77.867 55.959 46.787 -21.876 268.835
## 14 03a04Wc Ang 15.530 -0.337 49.928 241.626 74.898 139.191 167.740 -10.842 260.153
## 15 03a05Aa Fea 14.007 -0.706 85.523 363.118 75.201 193.033 187.700 -19.254 309.652
## 16 03a05Fc Hap 11.662 -1.508 50.947 324.113 75.728 161.582 138.468 -23.989 312.993
## 17 03a05Nd Neu 3.480 -0.702 46.805 86.754 77.140 158.367 128.839 -25.468 326.156
## 18 03a05Tc Sad 0.329 -0.502 44.231 65.730 77.487 114.261 108.254 -29.039 393.742
## 19 03a05Wa Ang 11.195 0.835 48.116 504.413 73.774 146.226 168.905 -17.978 272.416
## 20 03a05Wb Ang 16.536 0.858 70.195 161.294 73.372 207.033 241.235 -14.027 363.4383. Comparison between acoustic cues in Praat and Vokaturi
We may consider the analyses by Praat to be the “golden standard”. The analyses by Vokaturi come close, but also exhibit small differences.
3.1 Comparing average pitch (pitAve)
The measurements for pitAve are highly correlated between Praat and Vokaturi, as can be seen with a tiny R script:
plot (cuesP$pitAve, cuesV$pitAve)
abline (0, 1)
cor (cuesP$pitAve, cuesV$pitAve)## [1] 0.9932971There seems to be a bias, though, with Vokaturi yielding slightly lower pitches than Praat. This is probably caused by the fact that Praat employs the more accurate sinc interpolation method, whereas Vokaturi employs parabolic interpolation. This is a point for future improvement, though it is not likely to affect emotion recognition in any measurable way.
3.2 Comparing pitch dynamics (pitDyn)
The measurements for pitDyn match moderately between Praat and Vokaturi:
plot (cuesP$pitDyn, cuesV$pitDyn)
abline (0, 1)
cor (cuesP$pitDyn, cuesV$pitDyn)## [1] 0.663999The measurements in Vokaturi tend to be larger than those in Praat, because Praat includes pitch movements across voiceless stretches and Vokaturi does not.
3.3 Comparing average intensity (intAve)
The measurements for intAve correlate very well as well:
plot (cuesP$intAve, cuesV$intAve)
abline (0, 1)
cor (cuesP$intAve, cuesV$intAve)## [1] 0.97432393.4 Comparing intensity dynamics (intDyn)
The measurements for intDyn correlate reasonably and show no bias:
plot (cuesP$intDyn, cuesV$intDyn)
abline (0, 1)
cor (cuesP$intDyn, cuesV$intDyn)## [1] 0.8685753.5 Comparing spectral slope (spcSlo)
The measurements for spcSlo correlate reasonably and have a constant bias:
plot (cuesP$spcSlo, cuesV$spcSlo)
abline (0, 1)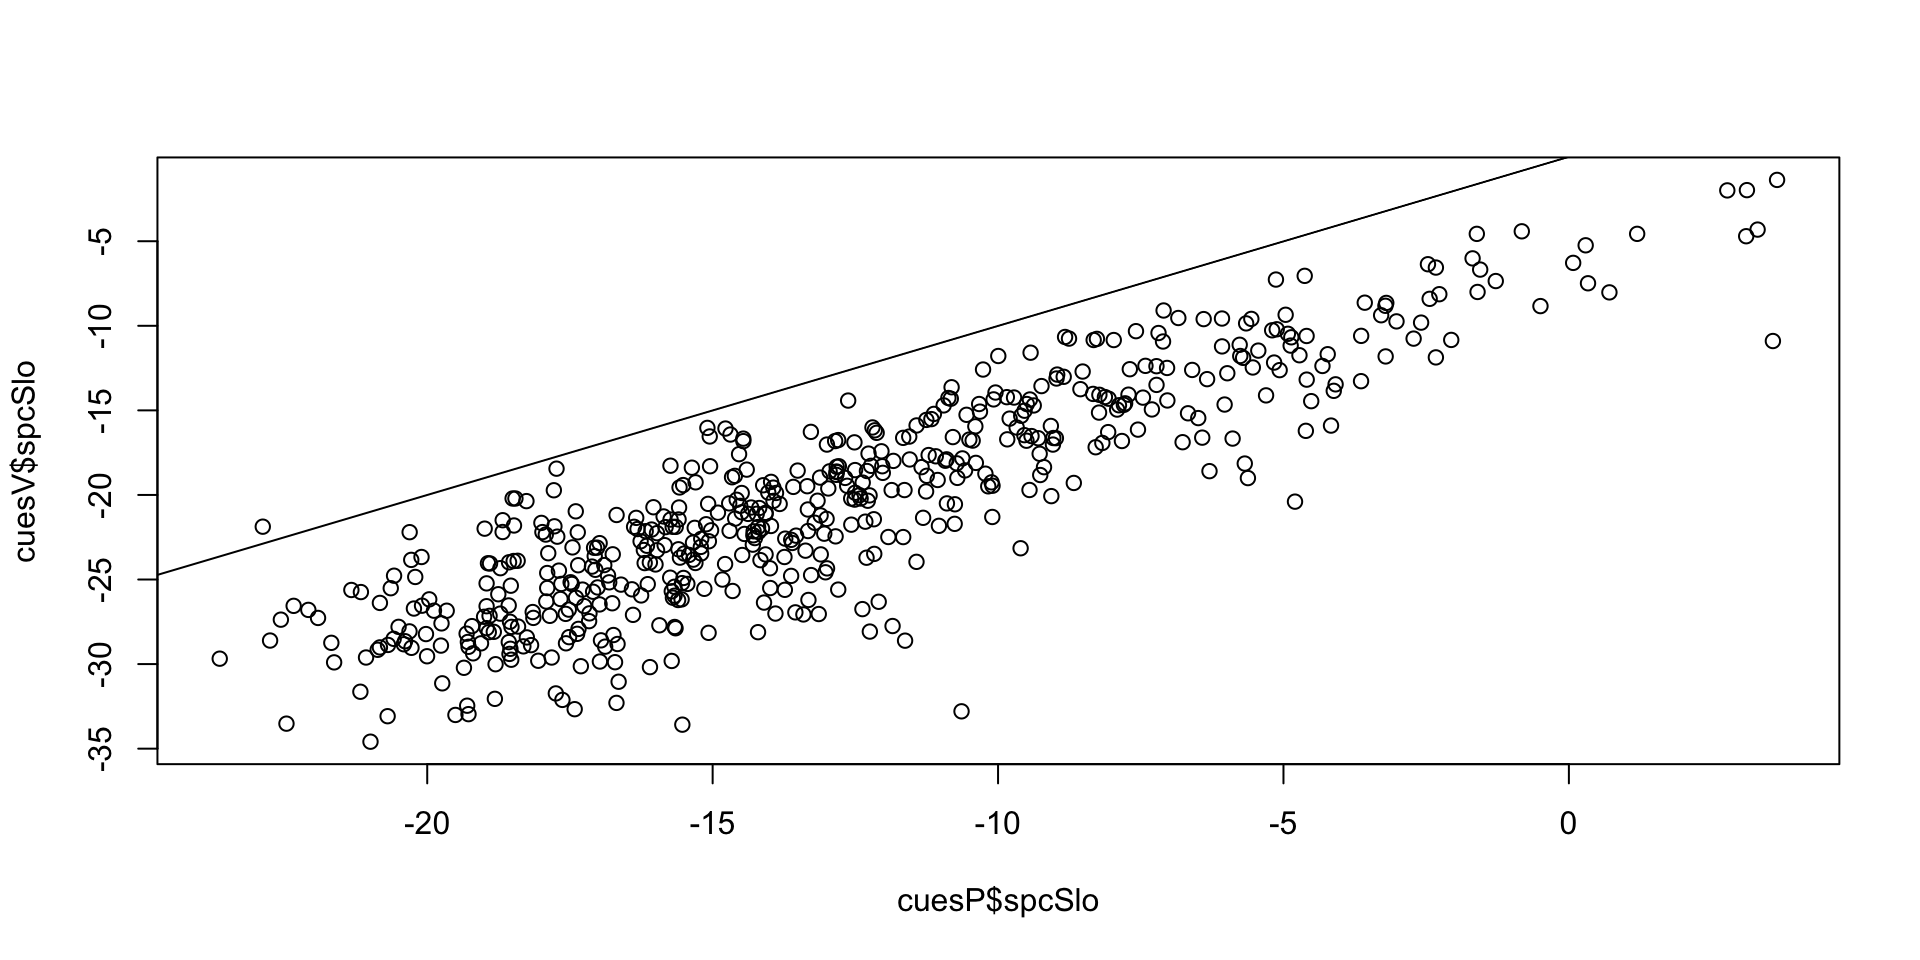
cor (cuesP$spcSlo, cuesV$spcSlo)## [1] 0.882462